
Economic Activity
This resource explores the patterns of economic activity across the country in the 2011 Census. Specifically looking at unemployment and the retired population.
Click through the tabs below to view the resource, or click to download the resource as a PDF file.
In this resource, students will investigate economic activity of all people aged 16 to 74, focusing on employed, unemployed and retired status as recorded in the 2011 Census.
Constantly evolving news items on economic activity such as:
Scottish unemployment rises by 5,000 https://www.bbc.co.uk/news/uk-scotland-scotland-business-43485354 BBC, 21 Mar 2018
Jobless men in Dundee should ignore stereotypes to pursue ‘female’ careers, business chief says https://www.thecourier.co.uk/fp/news/politics/scottish-politics/670407/jobless-men-in-dundee-should-ignore-stereotypes-to-pursue-female-careers-business-chief-says/ Courier, 14 June 2018
- Go to the DataNation homepage: datanation.edina.ac.uk
- Enter your school’s username and password and click login.
Exercise 1.
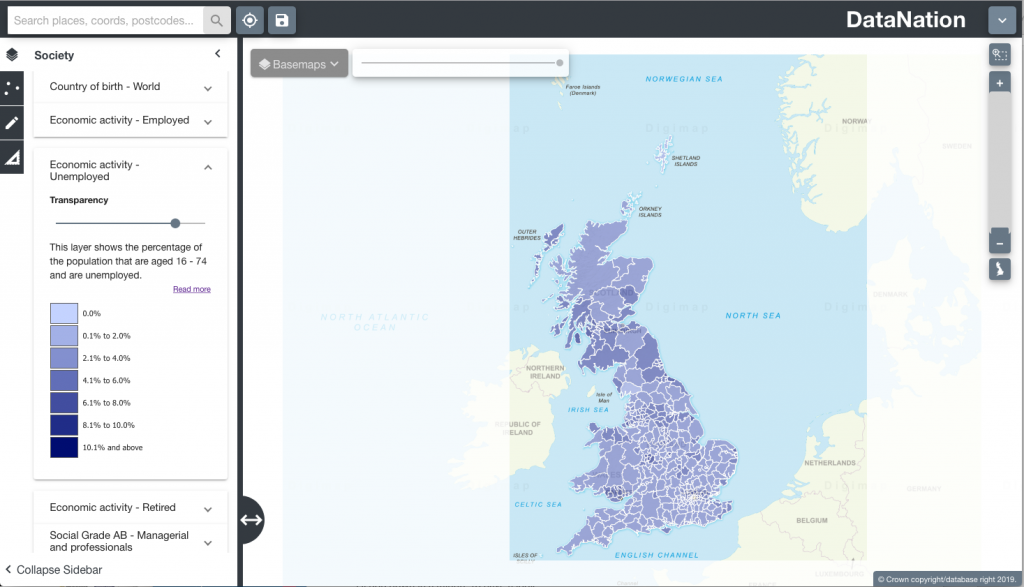
In this exercise, you will explore the mapping layers to visually interpret the Census data about economic activity. Begin by displaying the ‘Economic activity – Unemployed’ layer.
- Click the Society tab in the left-hand panel
- Scroll down to find the ‘Economic activity – Unemployed’ layer, click to view the map
- The map will update and display the percentage of the population aged 16-74 and are unemployed. Ensure you are zoomed out to view the whole country.
- Explore the data by zooming in (double-click the mouse or use the zoom bar on the top right) and panning the map.
Questions, Analysis and Interpretation
- Viewing GB as a whole, what can you conclude about patterns of unemployment?
- Compare the patterns to the current UK rate of unemployment – https://www.ons.gov.uk/employmentandlabourmarket/peoplenotinwork/unemployment
Exercise 2
In this exercise you will explore the raw data behind the maps.
- Click on the map to select a single Local Authority.The selected authority will be highlighted with a red outline and the full statistics for the authority will appear on the left-hand panel.
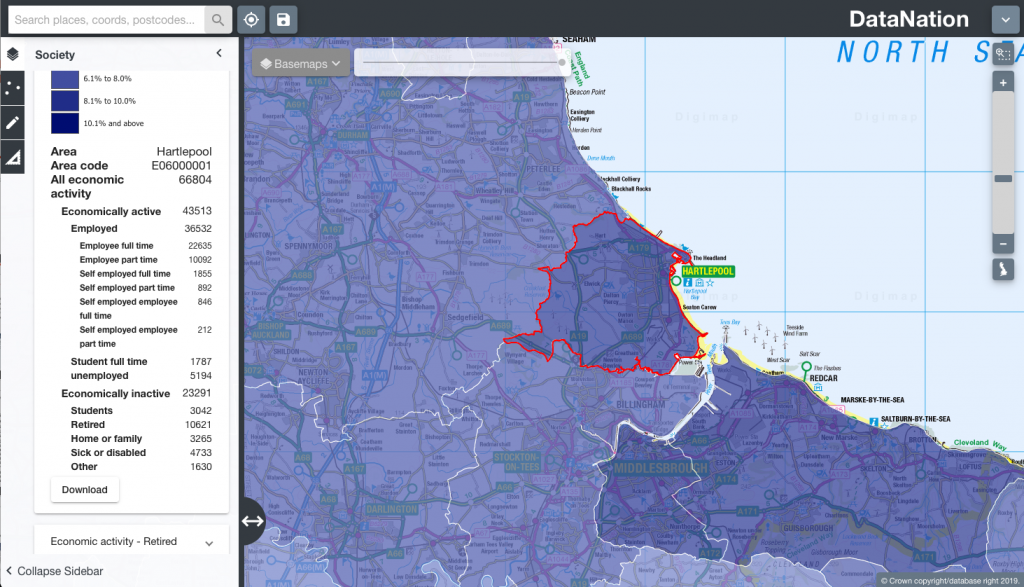
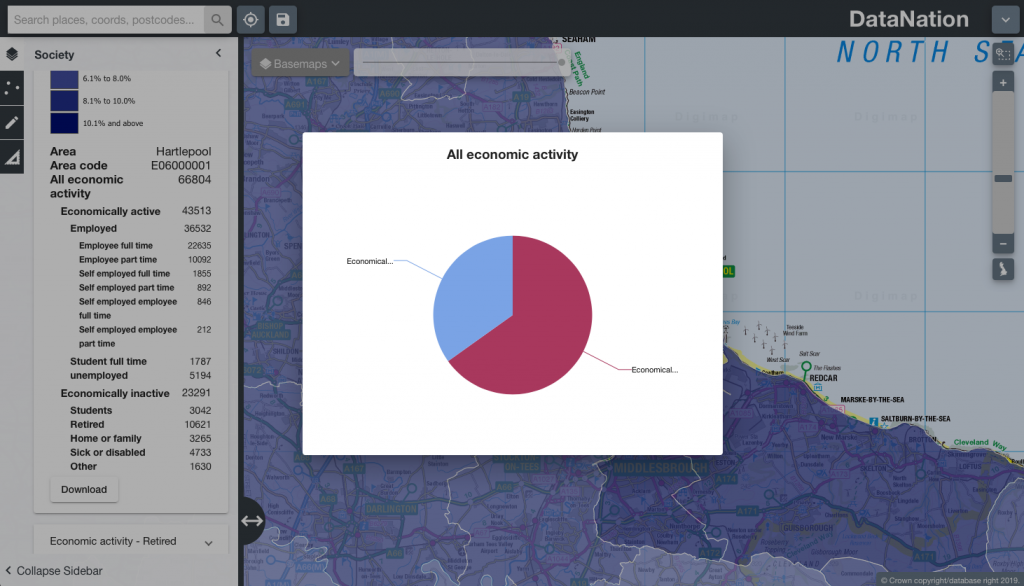
- The data on the left-hand panel shows all the related statistics for that area in the Economic activity – unemployed dataset.Click on the different levels of data to view a pie chart of the data.
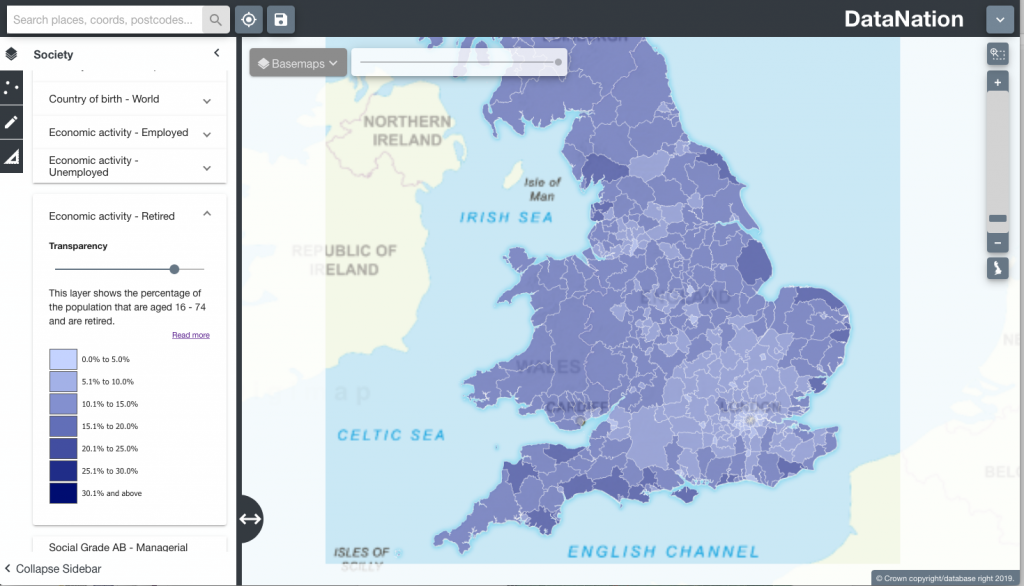
- Click to view the other economic activity datasets – Employed and Retired and look at the patterns of activity across the country and your local area.
Questions, Analysis and Interpretation
- Describe the Economic Activity data for your local authority, calculate percentages of the different categories to help understand the detail for your local authority
- Compare with some other authorities (selecting one at a time) do neighbouring local authorities have similar patterns of economic activity?
- Are there any distinct geography patterns for those that are employed, unemployed or retired? Where do you find the highest percentages of these groups in urban or rural areas?
Note the distinct geographic pattern of retired persons around England. What can you infer about the sort of lifestyle retired people enjoy?
- Now zoom further into your area of interest, you will see the local authority is broken down into smaller units. Describe the patterns of economic activity across the local authority, how much variation is there?
- Click on the smaller areas to view the raw data
- Zoom into even greater detail and repeat steps 2 & 3.
Exercise 3
Extend this investigation by downloading the raw data for your area of interest(s) by clicking the Download button at the end of the raw data table. Open this data in Excel. Organise and present the data to support your interpretation of the pattern of economic activity in the 2011 Census.
- Look again at current news items and most recently available data – have the rates and patterns of economic activity changed locally and nationally?

This work is licensed under a Creative Commons Attribution-NonCommercial-ShareAlike 4.0 International License.